
Nevada Financial Literacy Statistics
The Nevada Financial Educators Council (NVFEC) advances a clear, evidence-based understanding of financial wellness across the Silver State by systematically collecting current data and maintaining the accuracy of the information presented on this webpage. These data are made available to legislators, advocates, researchers, community organizations, and the broader public to support informed analysis and decision-making. By providing and maintaining these statistics, the NVFEC strengthens advocacy and policy development, reinforcing the Council’s ongoing commitment to improving financial well-being statewide.
Cost of Financial Illiteracy Survey
Nevadans report that lack of financial knowledge carries a high cost, according to the NFEC’s most recent survey. Participants across the state responded to the single question: “During the past year, about how much money do you think you lost because you lacked knowledge about personal finances?” The results are shown below. Since 2017, the NFEC has conducted this annual survey, consistently revealing that the average individual cost of financial illiteracy approaches or exceeds $1,000 per person – with estimated national losses reaching into the hundreds of billions of dollars each year, and losses in the hundreds of millions across Nevada.
Cost of Financial Illiteracy
$0 – $499
$500 – $999
$1,000 – $2,499
$2,500 – $9,999
$10,000 +
Nevadans’ Financial Vulnerability
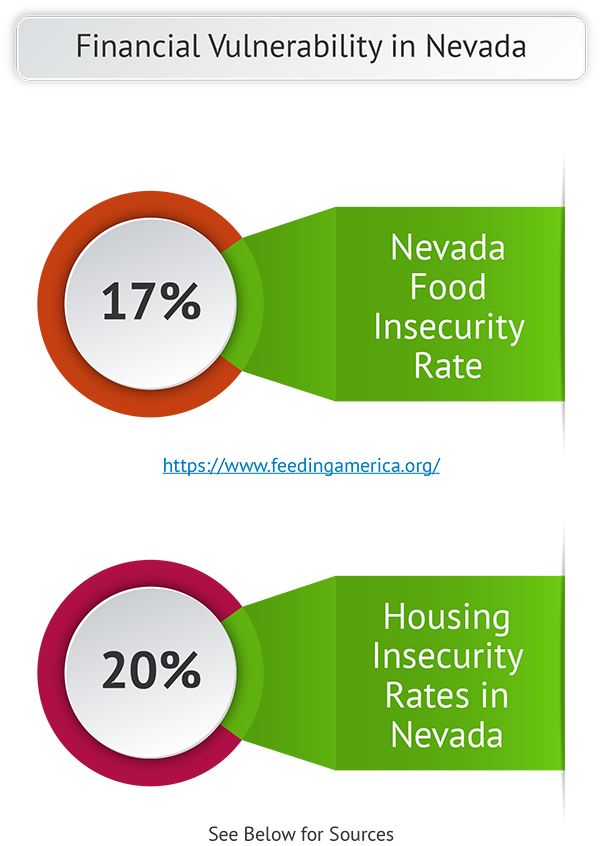
Two data points characterize the proportion of Nevadans who are financially vulnerable: food insecurity and housing insecurity. In regard to food insecurity, Feeding America – a nonprofit organization that reports hunger statistics nationwide – 1 in every 6 Nevada residents are going hungry in the state, and 1 in 5 children. In fact, among those households in the Silver State that receive supplemental food assistance from the government (SNAP benefits), 35.5% have children in the home.
The World Population Review offers recent information concerning state-by-state housing insecurity. In Nevada, their data indicated a total of 10,106 unhoused individuals residing there as of 2024, representing a homeless rate of 32.0 per 10,000 residents. That figure had increased by 16.9% since 2007. The term “unsheltered” used in the report is defined as living in temporary shelters or transitional housing; or sleeping at a site not meant to be inhabited, like an abandoned building.
If “housing insecurity” is defined broadly—as households facing significant risk of losing stable housing because of affordability, overcrowding, poor housing conditions, or payment difficulties—a reasonable estimate for Nevada today would be approximately 18–22% of households, with around 20% serving as a defensible midpoint, as of July of 2026. This estimate is supported by several indicators, including:
- Nevada consistently ranks among states with relatively high housing costs compared with household incomes.
- Housing prices and rents increased substantially during the past several years.
- Clark County (Las Vegas) and Washoe County (Reno) account for most of the state’s population, and have experienced persistent affordability pressures.
- Independent measures of severe housing problems and housing instability tend to cluster around the 19–20% range.
Sources used to generate this estimate are listed at the bottom of this page.
Statistics on Household Financial Situations in Nevada
Average Total Consumer Debt
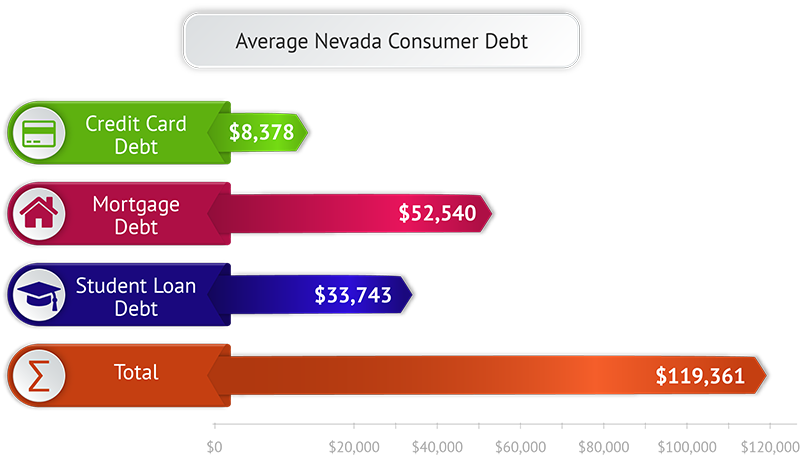
At the end of 2025, consumer debt among Americans totaled $18.57 trillion and an average household in the U.S. owed $104,755. An Experian study found Nevada’s average substantially higher than the nationwide figure: Silver State households owed $119,361, an increase of 1.1% over 2024.
Debt Loads by Category
Breaking down the total household debt by specific category paints a more complete picture in Nevada. For example, World Population Review places the average outstanding balance among Nevadans who carry student loan debt at $33,743 in 2026. This debt burden underscores how expensive the cost of higher education has grown in this country in recent decades.
WalletHub published a study in early 2026 that summarized credit card statistics by U.S. state. According to this report, Nevada had the highest average credit card delinquency rate in the country (16.28%). The average balance carried on credit cards by user was $8,378 in the Silver State. And additional research by the World Population Review indicated that Nevadans with mortgages owed an average balance of $52,540 on their property loans as of 2025.
Financial Literacy Education and Legislation in Nevada
Each year the National Education Association (NEA) publishes a report laying out the number of public schools, teachers, and enrollments by state in the U.S. The most recent report came out in 2026. According to the NEA’s data, Nevada had 20 operating public school districts in the 2024-25 academic year, with total enrollment of 477,563. A total of 21,524 teachers were instructing those students, for a student-to-teacher ratio of 22.2 to one.
In its 2025 iteration of The Nation’s Report Card on Financial Literacy, the American Public Education Foundation (APEF) listed Nevada’s significant legislative accomplishments related to financial literacy as having a required one-half credit of economics/financial literacy instruction in high school; a State Seal of Financial Literacy awarded to high school graduates who meet specific criteria; and financial literacy standards in place for grades 3-12. The APEF recommended that Nevada could improve its grade by making the high school requirement a standalone financial literacy course and instituting standards for grades K-2.
Nevada took important steps toward those goals with the passing of SB 229 in February 2025. This legislation revised the criteria for earning the State Seal of Financial Literacy to make the award more inclusive. The bill also expanded the requirements for provision of financial literacy instruction to include students enrolled in kindergarten and grades 1-2. The Silver State also has a Nevada State Financial Literacy Advisory Council established to promote financial literacy and education on a statewide basis.